Vilhelm Bjerknes (1862-1951) was a groudbreaking meteorologist who in 1895 developed primitive equations used to approximate atmospheric flow--and are still used in modern weather prediction models.
The forces involved are gravity, the pressure gradient, and viscous friction.
The equation terms:
* u is the zonal velocity (velocity in the east/west direction tangent to the sphere)
* v is the meridional velocity (velocity in the north/south direction tangent to the sphere)
* ω is the vertical velocity in isobaric coordinates
* T is the temperature
* Φ is the geopotential
* f is the term corresponding to the Coriolis force, and is equal to 2Ωsin(φ), where Ω is the angular rotation rate of the Earth (2π / 24 radians per sideral hour), and φ is the latitude
* R is the gas constant
* p is the pressure
* cp is the specific heat on a constant pressure surface
* J is the heat flow per unit time per unit mass
* W is the precipitable water
* Π is the Exner function
* θ is the potential temperature
The pressure gradient force causes an acceleration forcing air from regions of high pressure to regions of low pressure. Mathematically, this can be written as:
The gravitational force accelerates objects at approximately 9.81 m/s2 directly towards the center of the Earth. The force due to viscous friction can be approximated as:
Therefore, to complete the system of equations and obtain 6 equations and 6 variables:
Using Newton's second law, these forces (referenced in the equations above as the accelerations due to these forces) may be summed to produce an equation of motion that describes this system. This equation can be written in the form:
p = ρRT.
Bjerknes's work inspired Wagn Walfrid Eckman (1874-1954), a Swedish oceanographer and Carl-Gustaf Arvid Rossby in their work on the fluid motions of the oceans and the atmosphere, and laid the groundwork for the discovery of the Eckman Spiral and Rossby Waves.
The Eckman Spiral is one of the most counterintuitive discoveries in oceanography. Imagine a permanent large high pressure center over the middle of an ocean, like the Bermuda-Azores high. The winds circle around counterclockwise. But the effects of the Coriolis effect and friction cause the water right at the surface to move a little bit to the right of the wind motion. The water right under the topmost layer moves a little to the right of the topmost layer, and loses a little force through friction. Each layer down moves a little to the right, and loses a little force due to friction. Eckman was able to sum this up and discovered that the sum of all these currents is a tremendous inwards flow towards the center of the high pressure.
Oceanographers and meteorologists, when they thought about it at all, just assumed that the water level under a large permanent high pressure system was several inches lower than the surrounding water. Instead, Eckman showed it is several feet higher! This was so counterintuitive that for decades oceanographers had difficulty believing it was true, although it did explain why noreasters bring such high tides to the Atlantic coast. The sum of the force of the currents is 90 degrees to the right of the wind---a prolonged northeast wind will drive water to the northwest onto land. And Eckman's work was finally confirmed by satellite observations of sea level.
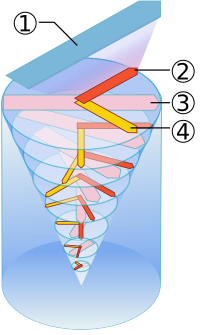
Eckman's spiral illustrated:
Ocean currents changing directions at an angle to the surface winds because of Coriolis effect
1. Wind
2. force from above
3. Effective direction of the current flow
4. Coriolis effect
Rossby waves are perturbations in the atmosphere that result from the variation in the strength of the Coriolis effect with latitude. The mathematical equations are considerably more numerous and complex than the primitive equations I posted, so I will omit those from the entry. Rossby waves are key to the transport of cooler air equatorward and warm air poleward.
Rossby waves are illustrated below, showing in this example how cold air can be drawn equatorward:

Back to Vilhelm Bjerknes. By 1913, he had come up with 7 variables that are capable of describing the characteristics and behavior of the atmosphere. These are:
The characteristics:
1. Pressure
2. Temperature
3. Density
4. Water vapor content
The vectors (wind)
5. East
6. North
7. Up
For the wind vectors, negative numbers would be used for the wind moving from a westerly direction, a southerly direction, or a downward direction (subsidence).
Thanks to Bjerknes, Rossby, and Eckman (a LOT of other meteorologists, physicists, and mathematicians also made contributions, but these are the giants) we had the mathematical tools to predict weather. And with some modifications, climate. There were some big problems though. How could we ever get enough data to make meaningful use of the equations. And even if we had enough data, how could we ever solve the equations fast enough to make timely forecasts?
100 years ago these problems seemed insurmountable. But Lewis Fry Richardson was about to try. And in the next entry, I'll tell you about him.
Eckman's Spiral has great relevance to global sea level rise as the Earth warms. The oceans are not flat, and changes in the positions of our semi-permanent high and low pressure regions have the potential to greatly augment, reduce, or even reverse sea level rise in local areas.
ReplyDeleteEckman spirals cause alterations in sea level as much as 2 meters (7 feet) or so. On the east coast of the USA, sea level is highest along North and South Carolina, in closest proximity to the Bermuda-Azores high. Sea level in Bermuda is about 2 feet higher than that. If the Bermuda-Azores high were to shift say 5 degrees latitude to the north, its displacement would slow down or stop sea level rise along the south Atlantic coast, (and Bermuda), while greatly increasing sea level rise along the Mid-Atlantic and Northeast coastlines. That's just a hypothetical. As the greenhouse effect progresses it is not clear how it will effect the position and strength of semi-permanent high and low pressure zones. Local geological factors also play a role, with land rising and falling. A good site for viewing current sea level changes is here: http://tidesandcurrents.noaa.gov/sltrends/sltrends.html